PRIMER · LAST UPDATED 23 SEPTEMBER 2026
How to Read the Inference Market
A primer on pricing, benchmarks and market structure
Each section explains one concept of the inference market. Where that concept appears in the published benchmark, a closing note marked with a gold rule shows where to find it on atticstandard.com.
PART ONE
Inference as a commodity
What is bought and sold, and in what units
§ 1.1
The cost that grows with success
Training a model is a one-time outlay, however large. Serving it is a cost incurred every time someone uses it: each question answered, image rendered and minute of audio transcribed is a separate purchase of inference. As AI moves from pilots into production, inference consumption multiplies with every user, every workflow and every agent running, day or night. Inference is the operating cost of artificial intelligence, the line that grows fastest precisely when a product succeeds, and the one that decides whether its unit economics hold as it scales.
§ 1.2
A market built in layers
Around that demand, supply has organized at speed. Model developers sell their own models directly. Cloud marketplaces distribute them inside the platforms enterprises already buy through. Inference platforms and neoclouds run models on their own infrastructure, very often the same open-weight models, and compete for the same customers on price and throughput.
The scale of it settles the question of what this is. Dozens of sellers now publish thousands of priced listings covering around two thousand distinct models, with the same model available from a dozen competing hosts at a dozen different prices. At that size, a catalog is no longer the right frame. This is a market, and it reprices constantly: a model launches, hosts list it within weeks, a lab cuts its rate, and competitors answer.
§ 1.3
Comparability comes first
Inference prices share a market but arrive in different forms. One vendor quotes per million tokens and another per thousand; one prices audio per hour and another per second; the same model carries one name at its developer and three others across its hosts. Read side by side as published, the prices are close to unusable. Once comparable, they form a market with a price, and that is the precondition for everything a buyer, a seller or an analyst wants to know about it.
Attic Standard publishes that reference. Every price is normalized to the unit of its market and every listing resolved to one canonical model, whatever name its seller uses, so thousands of listings from dozens of sellers sit on one basis. This primer explains how to read the result.
§ 1.4
The units of trade
Each form of inference trades in the unit that best captures what the customer receives: tokens for language, images or megapixels for image generation, seconds or clips for video, minutes for transcription, characters for speech. Where two units describe the same thing at different scales, converting between them is simple arithmetic. Where they describe different things, such as a whole image against a megapixel, any conversion would require guessing the customer's usage, and the honest answer is to treat each unit as its own market.
Every published price is converted to the standard unit of its market wherever the conversion is pure arithmetic. A unit that needs an assumption to convert forms a market of its own, published as a separate index once it holds enough models, which is why Attic Standard publishes two dedicated indexes each for image and video models.
§ 1.5
The legs of a price
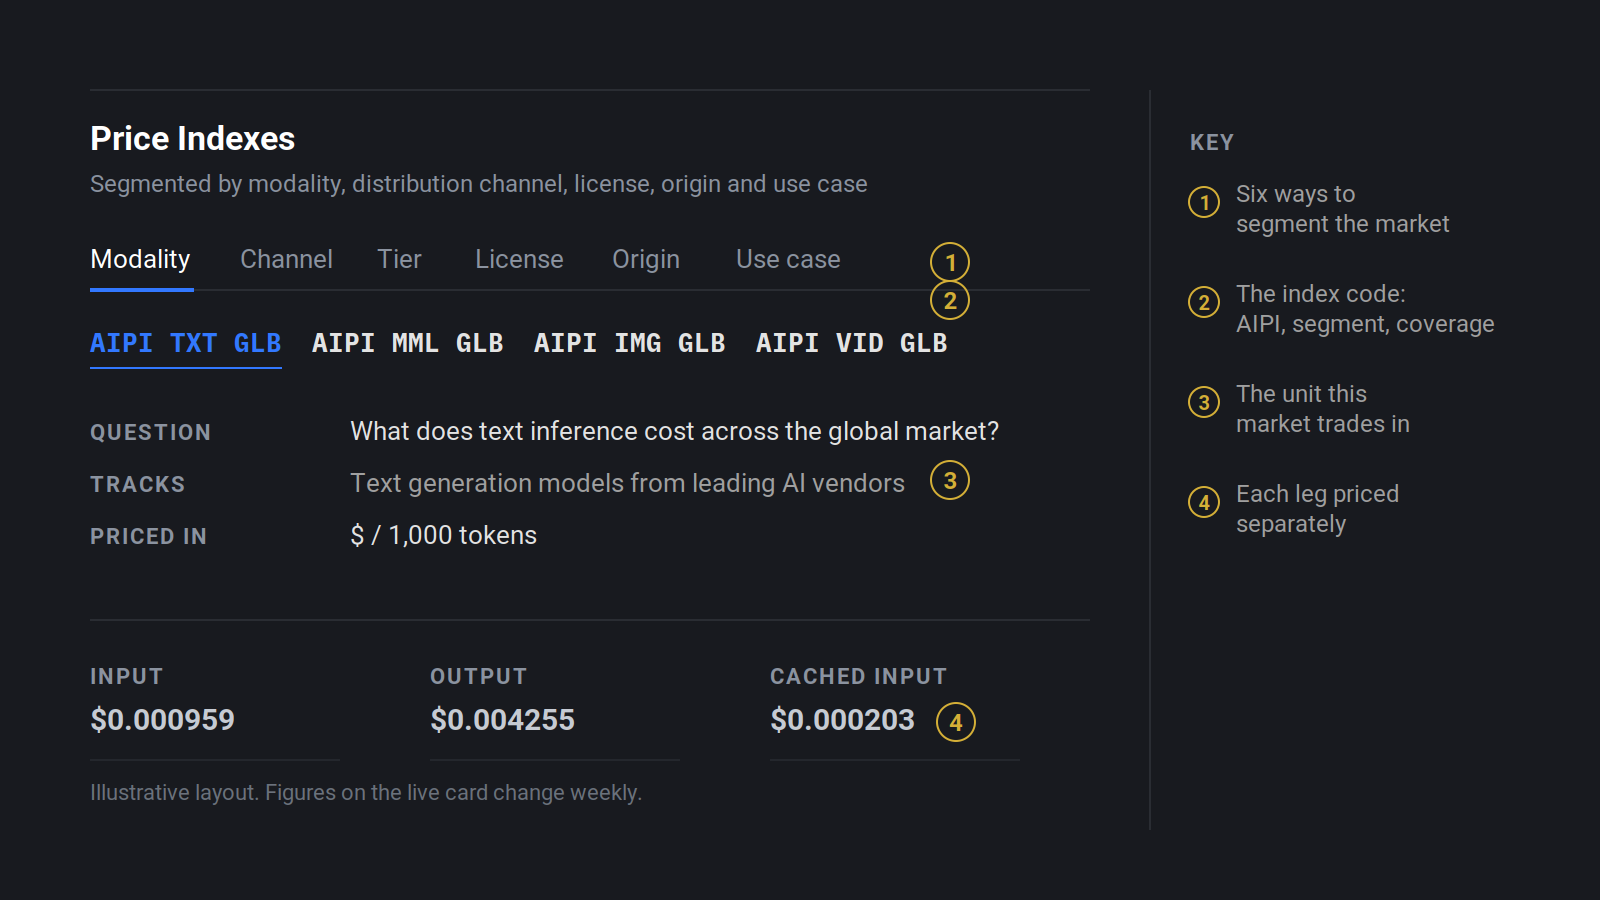
Every inference request has two sides, what goes in and what comes out, and vendors can price either or both. A language model charges one rate for the tokens it reads and another for the tokens it writes. A multimodal model may charge for an image or an audio clip on the way in and for text on the way out. An image generator is usually priced on its output alone, per image delivered, while transcription is priced on its input, per minute of audio received. Token-priced models often add a third leg, cached input, charged at a steep reduction when the same input is sent again.
In pricing terms, the legs sit far apart and move independently, with output commonly priced at a multiple of input and cached input at a fraction of it, much as a single crude stream carries different prices by grade and delivery terms. That makes the mix of legs, and therefore the shape of the workload, the real driver of cost. A system that reads long documents and returns short answers spends on input; one that writes reports or renders media spends on output; an agent that resubmits the same instructions at every step spends a large share of its budget on cached input.
Each leg is indexed separately, in its own unit, so every reader can apply the mix that matches their own workload.
§ 1.6
The cached tier
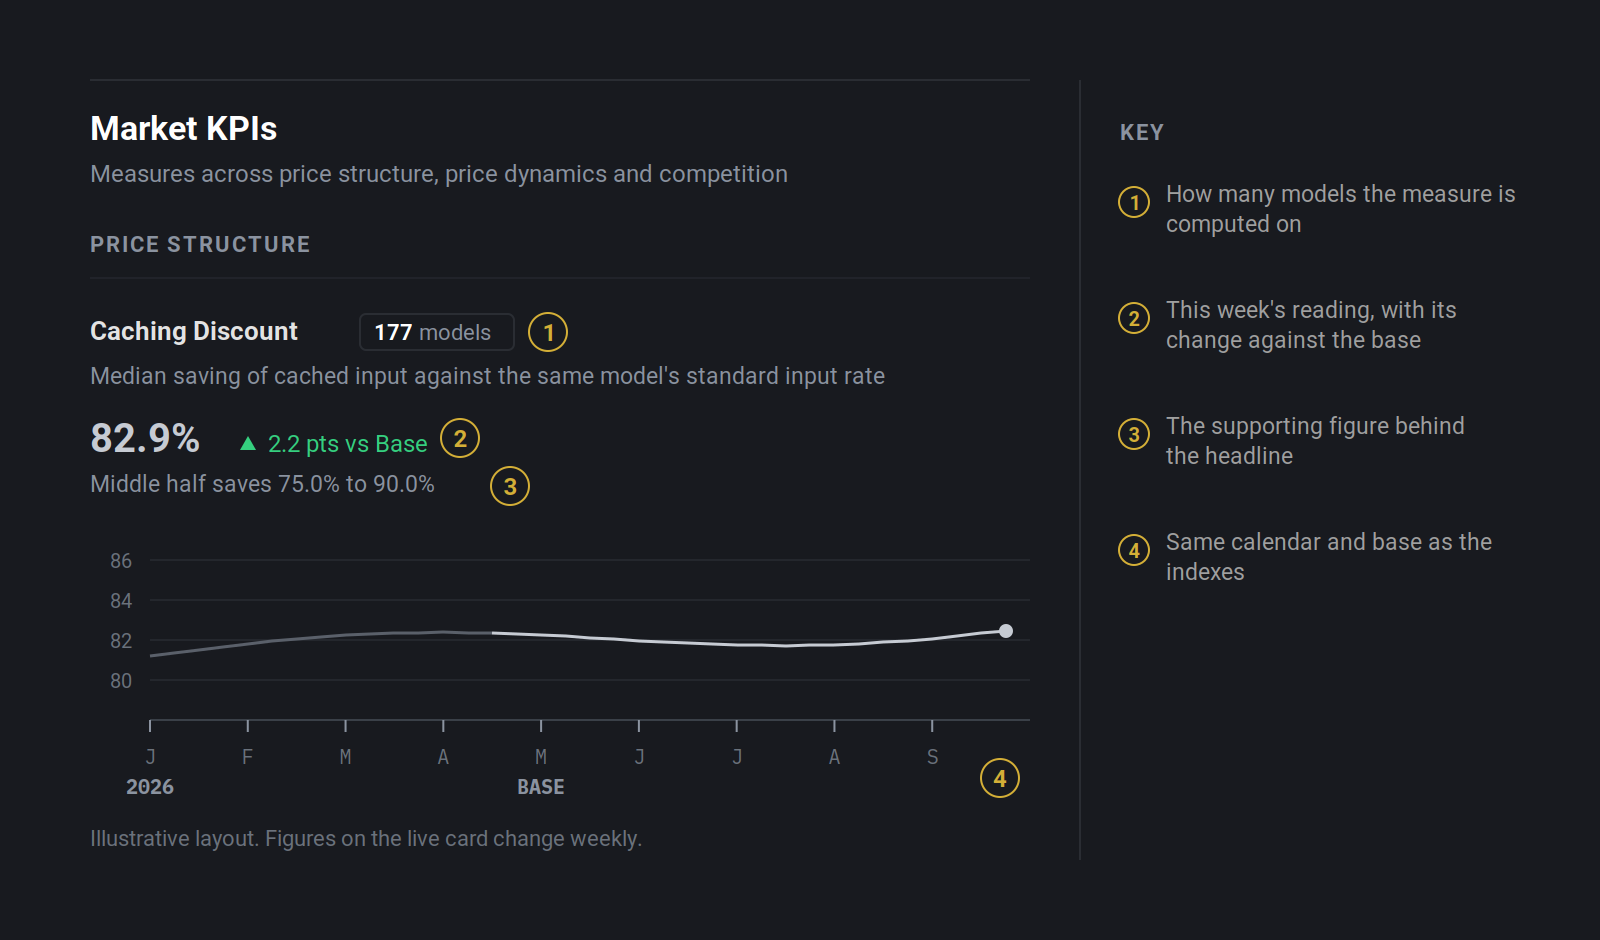
On token-priced models, cached input has become one of the sharpest fronts of competition. A vendor that retains the opening of a prompt charges a fraction of its standard rate each time that text returns, and for agents and retrieval systems, which resend the same context thousands of times, the cached rate can matter more than the headline one. A growing share of models is now sold with such a rate.
Cached prices are indexed over the caching cohort, the models sold with a cached rate, with that cohort's standard input and output published beside them, so every cached rate is read against the same models.
§ 1.7
Where the commodity lives
A commodity is a product whose units are interchangeable, so that price becomes the ground on which sellers compete. Different models are differentiated by capability, and each is a product in its own right. The same model sold by several companies is a different matter: an open-weight model hosted by a dozen providers is the same product at every one of them, and each host wins or loses business on price. That is where inference already trades like a commodity, and the segment grows every time a lab publishes weights and new hosts rush to serve them.
The market's prices are posted rather than traded. Each vendor sets its list rate and changes it at will, with no exchange to discover a common price between them. Posted-price commodity markets have long solved this through price reporting agencies (PRAs), which collect every posted rate on one comparable basis and publish the reference both sides of a trade can use. That reference comes in two forms, much as oil markets follow both an assessed price and an index of its movement, and Part Two explains each.
PART TWO
Reading a price reference
Spot, benchmark, and what each one answers
§ 2.1
Spot: what the market charges today
Faced with a quote, the first question is simple: is this a good price? Answering it takes two numbers. The first is the typical price in that part of the market. The second is the range around it, which shows what counts as a normal price and what stands out.
Getting the typical price right takes one piece of care. A popular open-weight model might be sold by twenty hosts, while a proprietary model is sold only by its maker. Counting every listing would let that one popular model dominate the figure twenty times over, so each model is reduced to a single price first, and the market price is taken across models. One model, one vote.
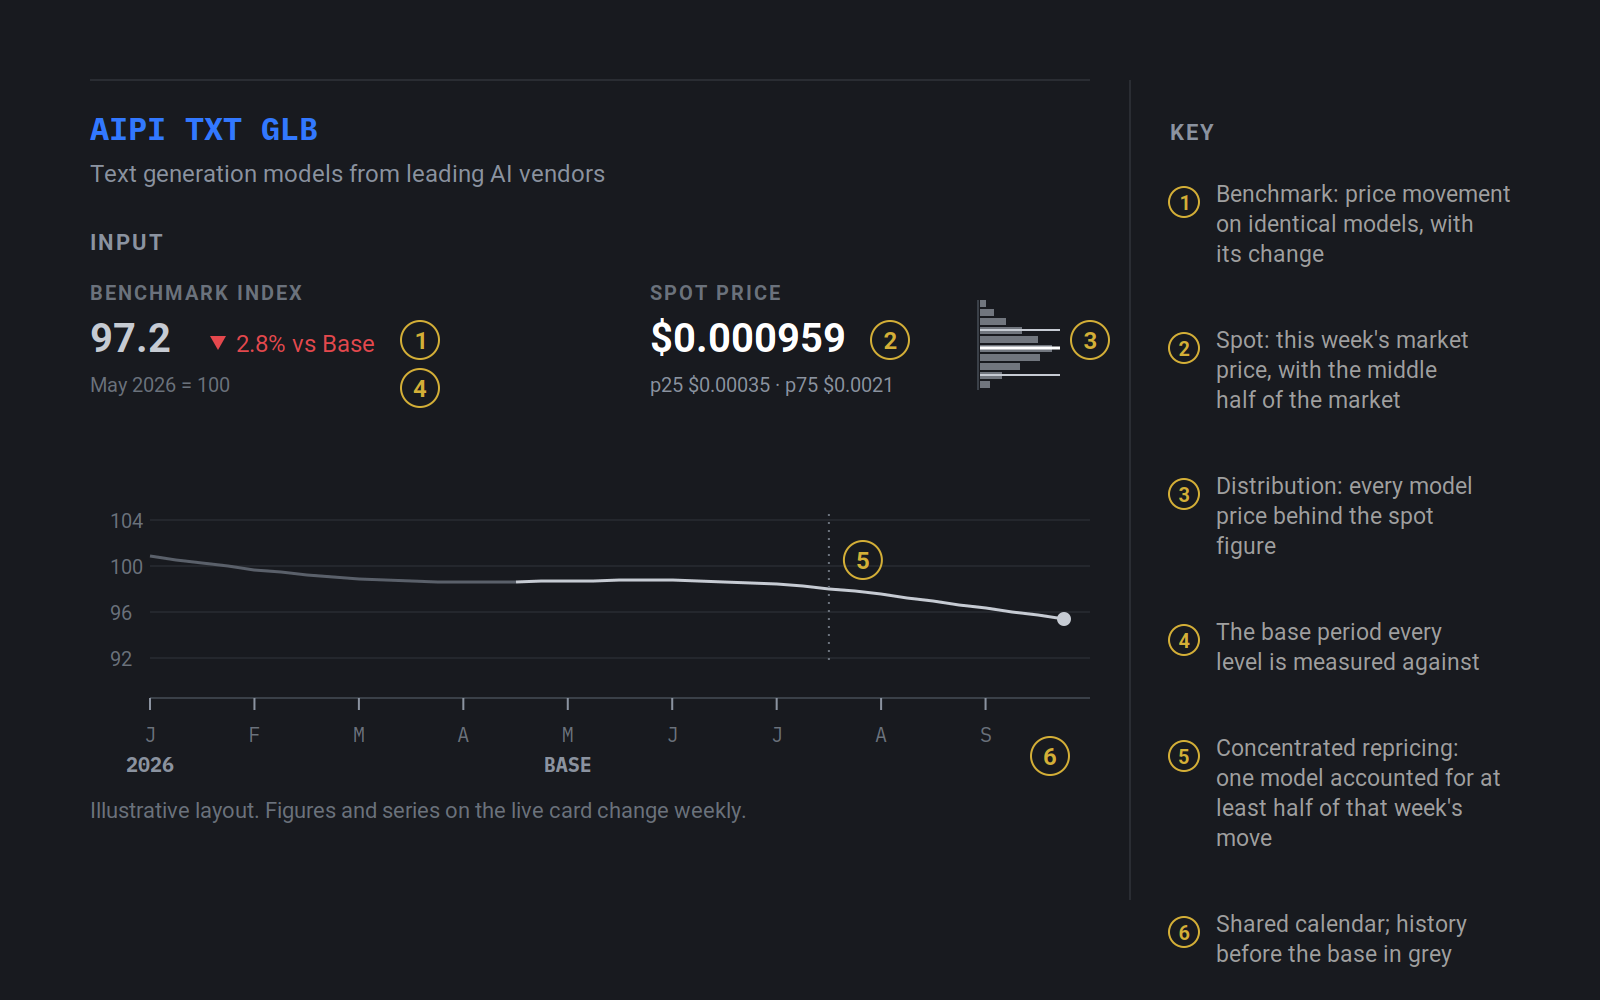
Every Attic Standard index publishes a weekly spot price in dollars with its 25th and 75th percentiles, and each model counts once whatever the number of its vendors. Terminal and Feed subscribers see the listings beneath that figure: every vendor's price for every model, which is where a negotiation actually starts.
§ 2.2
Benchmark: where prices are heading
The second question is about direction: is the market getting cheaper, and how fast? An average of whatever happens to be listed each week gives a misleading answer, dropping whenever a cheap model launches and rising whenever one retires, even while every individual price stays put. A reliable benchmark should follow the same products week after week, so its movement reflects genuine repricing and nothing else.
The indexes chain on identical models from week to week, one vote per model, following the construction statistical agencies use for consumer price indexes.
§ 2.3
Direction and position
Together, the two readings answer the questions that matter in any trade negotiation. The benchmark gives direction, whether prices on the same products are rising or falling. The spot price and its distribution give position, where the market stands this week and how widely prices spread around it. Anyone holding a quote can then place it precisely: below the median, the price is keen; inside the middle half, it is ordinary; above the 75th percentile, it is high against most of the market.
Each index card shows the benchmark's trend beside this week's spot price and its full distribution. Terminal subscribers can also follow the spot price's own history.
§ 2.4
Base periods and change
An index level only becomes readable against a base, a reference period set to 100. A level of 97.2 means prices sit 2.8% below the base, and when a whole family of indexes shares one base, any two can be compared at a glance. Change is then read over three horizons: since the base for the longer trend, over a month for momentum, and over a week for the latest move.
May 2026 is Attic Standard's base, and each level carries its change against the base, month on month and week on week.
§ 2.5
The shape of the market
Two markets can share a typical price and behave entirely differently. In one, sellers cluster tightly around it; in the other, prices for the same kind of product range many times over. The shape of the distribution shows which market a buyer is in, and in a wide one, knowing where a quote sits is worth real money.
Beside each spot price, the card shows the full distribution of model prices, with the spot and quartiles marked on it.
§ 2.6
Reading a price chart
A price chart earns trust by being explicit about its own history: where each series begins, which period it is measured against, and which weeks were moved by a single product rather than the market at large. That last flag matters in any equally weighted index, where one sharp repricing can shift the level as much as a broad wave of small ones.
The charts share one calendar from January 2026, show history before the May base in grey, and mark any week in which a single model accounted for at least half of the movement.
PART THREE
Six ways to segment the market
The cuts that turn one price into an answer
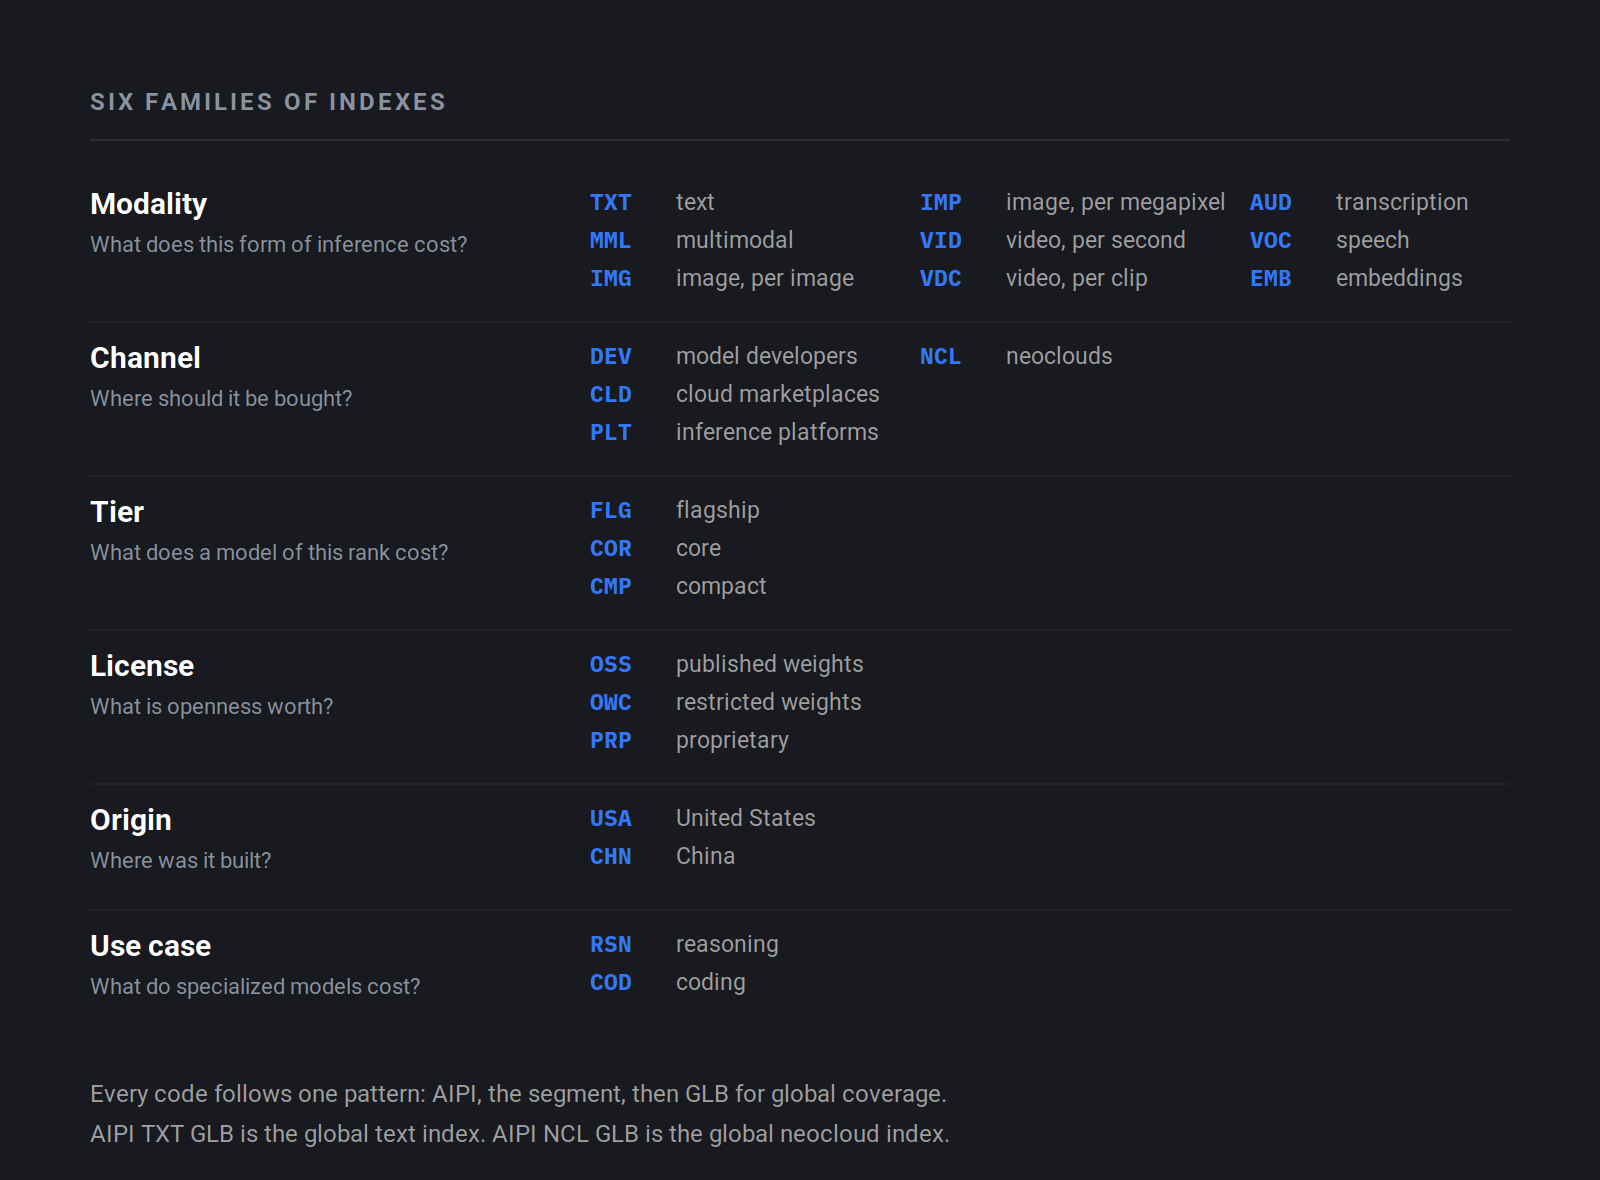
A single market-wide price answers almost none of the questions buyers actually face. Oil traders never quote "the price of oil" without a grade, a location and a delivery term, and inference divides along the same kinds of lines. Attic Standard publishes an index for each segment, coded AIPI (AI Price Index), then the segment, then GLB for global coverage: AIPI TXT GLB is the global text index, AIPI NCL GLB the global neocloud index.
§ 3.1
Modality: the product grade
What does this form of inference cost? Text, multimodal, image, video, transcription, speech and embeddings are distinct products with distinct units, and they move on distinct cycles, with token markets typically repricing faster than media.
The modality family covers each, with image and video indexed in both of their units.
§ 3.2
Channel: the route to market
Where should it be bought? The same model can reach a buyer directly from its developer, through a cloud marketplace, or from an independent platform or neocloud, and the price of an identical product can differ markedly by route.
Each of the four channels has its own index, and every listing belongs to exactly one.
§ 3.3
Tier: the quality grade
What does a model of a given standing cost? Makers grade their lineups from frontier models to everyday workhorses to economy options, and price cuts rarely land on every grade at once, which makes the tiers an early read on where competition is concentrating.
Flagship, Core and Compact follow each maker's own positioning, dated so a model counts in the tier it held at the time.
§ 3.4
License: the terms of supply
What is openness worth? A model with published weights can be hosted by any company, which invites direct price competition on an identical product, while a proprietary model is sold on its maker's terms.
Separate indexes cover models with published weights, the restrictively licensed subset of those, and proprietary models.
§ 3.5
Origin: where it was built
Where do the models come from? Origin records where a model was created, whatever the location of its sellers, much as crude is identified by its field rather than the port it ships from.
US and China origin each carry an index, since the two countries originate the vast majority of the world's inference models.
§ 3.6
Use case: the specification
What do models built for a specific class of work cost? Specialized models compete within their own niche while being priced against the wider market, and the gap between them is itself a signal.
Models built for specialized use, including reasoning and coding, are indexed against the same standard as every other segment.
§ 3.7
Pairs worth reading side by side
The sharpest readings come from contrasts: standard against cached rates, developers' own prices against independent hosts, proprietary against open models, frontier against economy tiers, one country of origin against another. Some segmentations divide the market cleanly while others overlap, so index levels are compared with one another rather than added together.
PART FOUR
Market structure
Who supplies the market, and how it behaves
§ 4.1
Where supply comes from
Prices say what the market charges. Structure says who stands behind those prices and how much power each seller holds, the equivalent of reading depth and concentration before trading a physical commodity.
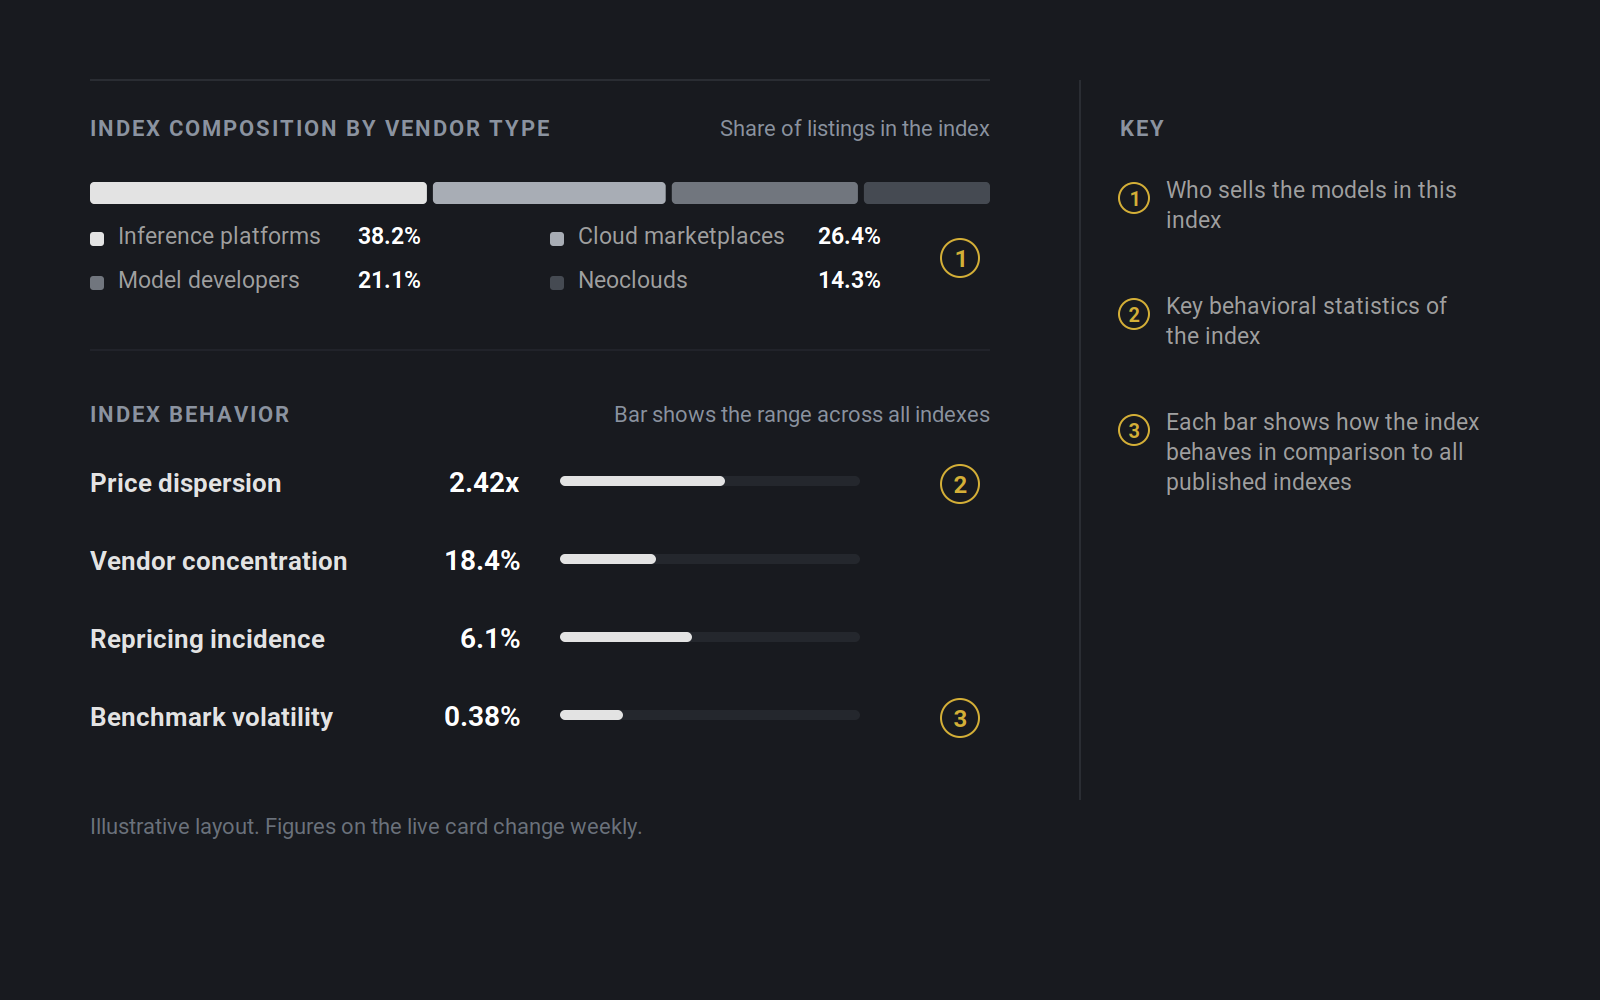
Two maps tell different stories: where models are built, and where the companies selling them are based. They diverge constantly, since a model built in one country is hosted across many others, and the gap shows how far a market's supply has spread beyond its origin. The mix of seller types matters as much: a segment supplied mainly by independent hosts is usually one where identical products fight on price.
Each Attic Standard index card maps its composition by country in both readings and shows its supply by vendor type.
§ 4.2
How a market behaves
Four readings reveal the character of any price market. Dispersion shows how widely prices spread, and a dispersed market rewards whoever compares. Concentration shows how much supply one seller controls, and a concentrated market moves when that seller moves. Repricing frequency shows how often prices actually change, and volatility shows how hard the level swings from week to week.
All four readings appear on the card, each placed against the range across every index.
§ 4.3
Sample size
A reading is only as strong as the evidence beneath it, so the number of products and sellers behind an index belongs right beside its level.
The listings, models, vendors and countries behind each index are published with it.
PART FIVE
Reading market measures
How the market prices, beside where prices stand
Indexes show where prices stand. Market measures show how the market works: how rates are built, how often and how sharply they change, and how sellers position against one another. Attic Standard publishes nine such measures, computed on the same prices as its indexes, each model counted once and each read against its May 2026 average.
§ 5.1
Price structure
MEASURE
WHAT IT READS
Output premium
Output on token-priced models has long carried about four times the input price by convention. The share of models priced above that line shows whether output-heavy work is getting relatively more expensive.
Caching discount
How deep the cached rate cuts below the same model's standard rate sets the payoff from caching for any workload that reuses context.
Caching availability
The share of models sold with a cached rate shows how far that payoff reaches across the market.
§ 5.2
Price dynamics
MEASURE
WHAT IT READS
Repricing activity
How often listed prices genuinely change, and whether the changes are cuts or rises.
Repricing depth
How large those changes are. Read together with activity, it reveals the market's rhythm: constant small adjustments, or long stillness broken by sharp moves.
Post-launch drift
How quickly a new model's price falls after launch, typically as more hosts take it up, which tells a buyer whether adopting early carries a price.
§ 5.3
Competition
MEASURE
WHAT IT READS
Multi-vendor spread
The gap between the most expensive and cheapest seller of the same model, in effect the cost of buying without comparing.
First-party premium
How often a model's creator prices above the independent hosts serving the same model, and whether the labs are closing that gap.
Marketplace premium
How often a model costs more on a cloud marketplace than from an independent host, and by how much: the price of buying through the platform an enterprise already uses.
PART SIX
From reading to decision
The same figures, on both sides of a trade
§ 6.1
For inference suppliers
A strategy, product or marketing team tasked with price optimization starts from position: where its rate sits in the distribution of its segment, and where it stands against every other seller of the same model. The benchmark adds direction, showing whether the market is moving toward or away from that rate. The market's rhythm of repricing then frames the decision itself, when a change will register with buyers and how large it must be to matter. Where cached rates have become standard, a listing without one is judged on a rate that cache-heavy buyers increasingly refuse to pay.
§ 6.2
For inference buyers
A buyer starts from the same question: which side of the distribution does this quote fall on? Keen below the median, ordinary inside the middle half, high above the 75th percentile. The benchmark indicates whether waiting is likely to pay. Channel comparisons show what each route to market costs for the same model, and caching measures show how much of a workload's bill can move to the cached tier. For a longer contract, a neutral benchmark offers a reference for review clauses, so a rate agreed today can track the market rather than fall behind it.
§ 6.3
Access
The weekly readings on atticstandard.com answer where the market stands. Acting on them takes the data beneath: the individual prices, the vendors behind them and the history they have followed.
Attic Standard delivers that data in three forms. The MCP server places the benchmark inside AI tools and agents, with a free tier for the published readings and listing-level detail on the professional tier, so a developer or an agent can check a rate in the flow of work. The Terminal is the analyst's view: the full history of every index and its spot price, listing and vendor-level comparison across every seller of the same model, and alerts when prices move. The Feed delivers the same data into a company's own systems, for pricing models, procurement dashboards and internal reporting under licence.
PART SEVEN
Why Attic Standard is trusted
The practice behind an accepted reference
§ 7.1
Impartiality
A benchmark works only when both sides of a trade accept it, and in commodity markets that acceptance is earned through practice: independence from the prices being measured, published sources, one rule applied to every product, documented decisions, verification before release, and changes made in the open.
Attic Standard sells no inference and holds no position in the prices it measures. It is privately funded and independently owned, with no vendor, buyer or marketplace holding a stake in it, and its executives hold no board or advisory positions with any company in the market it assesses. Commercial relationships, subscriptions included, have no bearing on any assessment, and no vendor sees a figure before it is published.
§ 7.2
Method
Every price is a published list rate captured at source each week from the seller that sets it. Every listing resolves to one canonical model, every model carries one vote and a documented admission decision for each index, and a week is released only after every tracked vendor is captured and verified.
§ 7.3
Governance
Publication follows a fixed weekly schedule, any figure can be queried and is answered, material changes to the method are announced before they take effect, and every restatement is dated and recorded. The full methodology is published at atticstandard.com/methodology.